Friday, August 9, 2013

A Heuristic for Task Work


My rule of thumb for Task work – and one I highly recommend Teams adopt as a part of their Team Working Agreement – is as follows: Every Team Member’s name appears on one and only one in-progress, unblocked Task at a time.
This rule does not preclude multiple Team Members from working on the same Task. It does preclude any Team Member from signing up for or attempting to work on more than one Task at time. And that’s the point. Single-item flow is the most effective, most efficient way known to develop a product.
This example (partial) task board shows the task heuristic in operation
The result of this simple rule is that no one is working on more than one Task at once, meaning no one is attempting to engage in multitasking. Another result of this simple rule is that Tasks not yet in progress are available, by virtue of the fact that they live in the To Do column on the Task Board, for any Team Member to work on, until one or more Team Members sign up for the Task. This simple visual cue helps the Team see what needs to be worked on and also helps drive cross-functional behavior on the Team by making it physically possible for anyone to sign up for any available Task.
Excerpt from The Agile Team Handbook, page 139.
 All for now....
 ..._._

Monday, July 9, 2012

The Complexity Trap, Part 2 - The Simplicity Solution

I presented this topic at Mile High Agile 2012 under the title: Great Teams Keep It Simple.

“Simplicity–the art of maximizing the amount of work not done–is essential.”

Agile Manifesto Principles

The first part of this post examined the complexity trap agile teams frequently fall into. Underlying complexity in team and work structures are reflected in equally complex artifacts that teams and leaders adopt in an effort to understand the problems they are encountering. Unfortunately, complex artifacts including backlogs, burndowns, and task boards, only serve to perpetuate or even enhance the underlying dysfunctions.

The only effective way out of the complexity trap - in my experience - is to work deliberately to apply the Agile Manifesto Principle of simplicity quoted above. The use of simple artifacts provides feedback that allows teams, leaders, and organizations as a whole to identify complexity and address it appropriately.

Here are a few questions to ponder:
  • How could the simplest thing that could possibly work be the best solution?
  • What should information radiators tell us?
  • Are we likely to finish everything we committed to this Sprint?
  • Which stories are at risk?
  • How much WIP (Work in Progress)?
  • What do we need to do today – as a team?
  • How many blockers are there?
  • How can I help?
  • How can simple tools foster and enhance teamwork?
Let's look at some examples of simple artifacts that answer these and other vital questions.

Single-dimensional Backlog


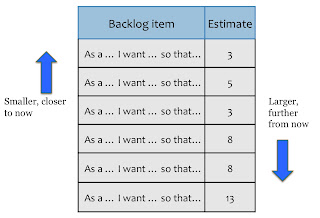
This backlog is a single-dimensional, force-ranked list of all the items you have thought of for the product, but are not yet being developed. If you are practicing Scrum, the Product Owner sets the order of the items, whether User Stories or whatever. There can only ever be one item at the top, one item in the second slot, and so forth all the way down. In keeping with the backlog iceberg metaphor, items are more detailed at the top, less detailed as one descends through the list. When continuously groomed, a simple backlog like this ensures that the most valuable, important items are always available for a team to pull in and work on at any given time.

Minimalist Task Board


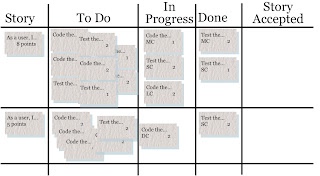
In contrast to the complex, multi-state task board depicted in Part 1 of this post, this task board is the model of simplicity. It contains a column for planned User Stories. It contains a column for planned tasks as they are currently understood. It contains a column for tasks in progress. Anything in these three columns comes under the heading of "not done" - either planned or in progress, with both of these categories clearly and instantly visible, but equally clearly not done. The fourth column holds tasks in a new state - done. The fifth and final column is for accepted User Stories, that is, stories whose Acceptance Criteria are satisfied - these stories are done.

Notice what's going on here. First there are really only two states reflected on this task board for any work item: not done and done. There are containers for planned work, mostly so that the team doesn't forget the results of conversations held during planning. Tasks in progress are instantly visible. Since work in progress (WIP) is by definition waste, this task board helps everyone focus on limiting WIP. Completed tasks move to the Done column - these tasks meet the team's definition of done and should not need to be revisited unless something out of the ordinary occurs. And finally, stories whose Acceptance Criteria the team has met - and in the Scrum world that the Product Owner has accepted - move to the Story Accepted column. These stories are done, finished, ready for customer/stakeholder review.

A minimalist task board like this one focuses the team on teamwork instead of individual work. Stories belong to no one team member, but to the team as a whole. Individuals, pairs, or groups may (and should) sign up for tasks, but the focus remains on pushing stories across the board, from top to bottom. The tasks take their proper place as a means to an end, and a highly malleable, flexible means at that.

A few additional rules that I recommend for using a minimalist task board effectively:
  • Each team member's name appears on only one unblocked task in the In Progress column at a time. This rule does wonders for WIP and also helps the team focus on team goals rather than individual preferences or expertise.
  • Work the stories from top to bottom - tasks deliver no value, stories do, so focus on stories regardless of individual task preference or expertise. Every team member does whatever it takes to help the team achieve its goal.
  • The team's definition of done must extend as close to "potentially shippable" as possible. Using a simple task board with the binary "not done-done" dichotomy of states pushes teams in this direction.
Simple, Effective Burndowns


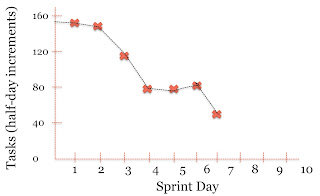
Burndown charts are somewhat controversial these days, but I still like them, especially for new or struggling agile teams. As with most other practitioners, I don't like task-hour burndowns for a whole variety of reasons that I won't go into here. Again, new or struggling agile teams - in my experience - need to break out the relevant tasks to deliver stories effectively. The tasks themselves aren't the key - the whole-team engagement and discussion is the vital aspect here. Whole-team ownership of every aspect of every story is what we're getting at and tasks are a good lever.

Back to the burndown, we could simply burn down the raw number of tasks. I'm fine with that if the team is able to break tasks down into roughly equal chunks. Most new or struggling agile teams lack the experience needed to achieve this goal. Moreover, unless team members estimate the tasks, they don't really even know how big the tasks are. So here's a simple rule I generally recommend teams adopt: Estimate tasks in half-day/day increments. Any task larger than a day is on the block to be chopped down to size. It's just another feedback loop I want teams to build into their work. It takes tremendous discipline to keep tasks small. Estimates provide feedback on task size, which empowers the team to take appropriate action when things get out of whack.

Now that you have tasks estimated in half-day/day sizes, simply burn down the total number of half-day increments: a half-day task counts 1, a full-day task counts 2. Add them up, plot a point, and you're done! And don't worry about precision. Half-day and day gradations are plenty good enough. Breaking tasks down further than this level of granularity is an exercise in false precision and begins to engage optimism bias. Think about it this way: over the course of a year and thousands of tasks, the estimates normalize around the median, which is all one can ask of an estimate.

Half-day/day task sizes also foster meaningful conversation and collaboration in the Daily Scrum (stand-up, or whatever you are calling it). Everyone can always talk about at least one task completed since the last meeting if tasks don't exceed one day in duration.

Story Point Burndown


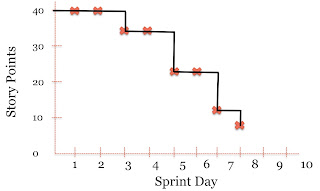
Stories deliver value. We want to know how we're doing on that. So burn down Story Points to reflect and radiate value delivered as the team delivers accepted stories. Enough said.

Team Working Agreements
Finally, team agreements foster team growth and strength. Remember that these are team agreements, not exhortations posted by management! When coaching agile teams, I suggest agreements that I think would be helpful, but no one can force a team to adopt a team working agreement - it must be a consensus team commitment. Here are a few examples:
  • We agree to pair-program at least two hours during each day of every Sprint.
  • We agree that each of us will work on at least one task per Sprint, either paired or individually, that is outside our area of specialist knowledge.
  • We agree that collaboration and collective, consensus-based decisions always produce better results than individual, even expert, opinion.
Post the full set of team working agreements in the team room for all to see. Reflect upon the team agreements regularly and update the list as conditions change.

I hope you've found this a thought-provoking and useful discussion on the merits of simplicity and simple solutions. In our hyper-complex world, we tend to disregard simplicity as being simplistic. Nothing could be further from the truth. When you encounter a complex problem, reflect on the Agile Manifesto Principle that started this post and look for a simple solution!

All for now....

...-.-

Monday, June 25, 2012

The Complexity Trap, Part 1

I presented this topic at Mile High Agile 2012 under the title: Great Teams Keep It Simple.

“Simplicity–the art of maximizing the amount of work not done–is essential.”

Agile Manifesto Principles

Agile teams and leaders tend to think of this principle in terms of reducing the complexity of the product being developed, from UI/UX flows to the back-end code. There is another area in which it is vital to focus on simplicity, however: the way we use various agile artifacts. Areas of complexity include:
  • Backlogs
  • Task boards
  • Burndowns
  • Individual “Velocities”
  • Utilization tracking/measurement
Backlogs
The most obvious way backlogs become complex is when they contain too many detailed stories. I have seen backlogs that contained thousands and tens-of-thousands of stories. Such backlogs are unworkable, unmanageable, and wasteful.

Another, less obvious but more insidious way backlogs become complex is when they are sliced along functional layers, rather than across those layers. Like a cake made of wood, stories written within functional layers make the Product Backlog rigid and impenetrable. Functionally layered backlogs are rife with irreconcilable dependencies and integration nightmares.


Task Boards
Task boards generally become complex in two dimensions: work states and team assignment. In the former case, the task board develops many columns, each depicting an intermediate state of doneness for tasks or even stories. In the latter case, the task board gets cut into sections, one for each team member, with tasks and even stories falling into individual team-member domains, often during Sprint Planning. In extreme cases, I've seen both of these dimensions of complexity expressed on the same task board.


The usual result of complex task boards is unfinished work at the end of the Sprint, as depicted below:


Sprint Burndowns

The Sprint Burndown is an element of transparency, showing the inner workings of the Sprint for all the world to see - and for the team to use as an input to daily decisions. Sprint Burndowns also frequently become so complex that they are essentially unreadable, as in the example that follows, which tracks, among other things, actual hours expended, an inherently damaging metric.


Tracking Individual Velocities
One of the most insidious artifacts I've seen in use is the tracking of individual "velocities" within a team, the implication being that stories are written in such a way that only one person works on any given story. The damage this type of metric inflicts on a team is incredible and often difficult or even impossible to repair.


Symptoms of Complexity

Some of the symptoms of complex work structures, as indicated by complex artifacts include:
  • People with nothing to do the last couple of days of each Sprint – usually “developers”
  • People with nothing to do until the last couple of days of each Sprint – usually “testers”
  • Gold-plated code
  • Poor quality code
  • Unfinished work most Sprints
  • “We’ll test later”
  • Internal team stovepipes that require hand offs
  • Morale and motivation problems
  • Lack of Teamwork
Complexity in agile artifacts creeps in, uninvited or intentionally, for a variety of reasons.
  • Lack of team cross-functionality
  • Lack of a dedicated team – resource pooling and matrixing people across teams
  • Artifacts of thinking – habit
  • Fear
  • Lack of trust, both within the team and between the team and the broader organization
I often find that complexity results from teams' and organizations' attempts to find ways to adapt agile to their existing project management and organizational assumptions. Agile is all about changing the way people and organizations work, to move beyond organizational structures and assumptions that arose to serve a different purpose and way of working. Clinging those structures and assumptions, long after they have ceased to be effective, is a major impediment to improvement at every level, from individual teams to the organization as a whole.

Next time, let's look at the opposite of complexity - simplicity - and apply the Agile Manifesto principle that started us off in practice.

All for now....

...-.-

Wednesday, February 22, 2012

Visualizing Cross-functionality with a Team Spectrograph

Cross-functionality is a key characteristic of agile teams. The benefits of cross-functionality are well-known, so I won't go into that here. But how can you tell if your team is cross-functional? How can you help your team become more cross-functional? How can you tell if you're making progress? All good questions. Fortunately, there is an answer.

Cross-functionality within a team doesn't just happen, it has to be deliberately and thoughtfully nurtured. So let's live the principle of Transparency and make it visible! A tool that I have found highly effective is the Team Spectrograph. A spectrograph plots amplitude against a segment of the radio-frequency spectrum. We can do the same thing with team skills, that is, plot the skill levels team members possess (the amplitude) across the spectrum of skill sets the team needs to have.

Here's how it works. On a white board or tear sheet, draw a standard x-y graph. On the x-axis, list the skill sets the team needs in order to deliver the work it is being asked to do, each skill representing a tic mark along the x-axis. On the y-axis, draw evenly spaced tic marks from 1 to 10, with zero represented by the baseline of the graph. Then, have each team member self-assess his or her skill level on that one-to-ten scale across all of the skill sets depicted. Have each team member use a different color marker and voila! - you have a team spectrograph that captures your team's cross-functionality as of that moment in time.


The example above depicts a team that is well-balanced across the needed skill sets, but lacks cross-functionality. The independent, non-overlapping peaks represent skill silos within the team.


This example depicts a team that is completely lacking the "Docs" skill set.

Using the Team Spectrograph to Grow Cross-functionality
Now that you can take a snapshot of team cross-functionality, you can take a new snapshot at a team Retrospective every three months, for example, to see progress and indicate areas where the team needs to focus on extending its cross-functionality. Using the first spectrograph above as a starting point, the following four depict the conscious development of team cross-functionality over the course of a year.

After three months...


After six months...


After nine months...


A year later...


Notice how all of the lines have come off the bottom of the graph indicating that every team member has at least some level of skill in each area. Notice also that the many skill areas have pegged the spectrograph. A side effect of transferring skills throughout a team is generally the enhancement of core competencies among team members. In order to teach someone else, we have to get better at what we already do best.

Team members can use their Team Spectrograph as a reminder to focus on techniques that build cross-functional skill sets, pair programming being the single most effective one I know of. The Team Spectrograph is also a reminder that cross-functionality doesn't just happen - teams grow and nurture their cross-functionality deliberately - one task at a time.

Another benefit of the Team Spectrograph is that it points out individual skills other team members were unaware of. Now that the full range of skills team members possess is visible, the team can take full advantage of its extant cross-functionality.

All for now....

...-.-


Updated:
I will be presenting this topic at the Atlanta Scrum Gathering, May 7-9! We'll have fun learning more about cross-functionality and building a real Team Spectrograph!

Thursday, October 20, 2011

Scrum Gathering London Wrap-up


Just a few words about the Scrum Gathering in London, October 11-13, 2011. I was honored to be selected to present a session: Getting Beyond Yes: From Cooperation to Collaboration. This was the first opportunity I have had to present this particular session and I was truly humbled (and stoked!) by the extremely positive response from the 40+ attendees.

In this session, which appeared in the ScrumMaster/Coaching track, I explored the key differences between cooperation and active collaboration on Scrum teams using the Thomas-Kilmann Conflict Mode Instrument as a hook into the ways in which people respond to intra-team conflict. The punchline is that as teams move from Norming toward Performing on the Tuckman model, individual team members learn how to break out of defending fixed negotiating positions and instead move into what Jean Tabaka calls Constructive Disagreement, which is the essence of collaboration. Cooperation modes tend to follow the path of least resistance, whereas collaboration, with its inherent friction, leads to breakthrough innovation. It was a fun session with quite a bit of good discussion and problem solving. I appreciate everyone who attended for contributing to our shared success!

I was extremely fortunate to be scheduled in the first session time slot on Tuesday, so the rest of the week in London was low-stress and extremely fun. The sessions I attended were of generally high quality and the conversations were top flight.

This was my first-ever visit to London, so sight-seeing was definitely on the agenda after the conclusion of the conference! London is (no news to anyone who has been there) an amazing city with incredible history, wonderful museums, and interesting walking. Narrow sidewalks and fast-moving buses and taxis literally inches away added a little additional excitement to several city walks. And to top it all off, the weather was great most of the week!

If you've never attended a Scrum Gathering, Agile Alliance conference, or local/regional agile conference, I highly recommend the experience. Presenting, participating, meeting old friends and making new ones are just some of the many benefits.

All for now....

...-.-

Thursday, September 15, 2011

The Burnout Chart

A little while ago I was talking with a Product Owner at a company just beginning its Scrum adventure. The topic of discussion was the Sprint burndown chart, its data points, and how to interpret the trend line indicated by those data points. The fact that the Sprint burndown is designed to serve as a planning tool for the team was not an issue. The Product Owner's concern was to ensure that the information radiated was interpreted appropriately by others in the organization, particularly those who might consider an upward spike in the burndown to be a sign that the team spent the day water skiing instead of working.

A teaching moment ensued and after a brief conversation and help from a colleague of the Product Owner, the purpose of the burndown was clear and agreement reached on using task hours remaining, among the alternatives I offered up, as the data point collected.

The discussion then turned to why one would use a burndown chart instead of tracking hours expended by the team in pursuit of the Sprint goal. Again, a teaching moment about the purpose of the chart, and then the insightful comment from the Product Owner that tracking hours expended would be plotted on the "Burnout Chart."

All joking aside, this strikes me as an interesting idea. Perhaps teams that are having difficulty working at a sustainable pace should use a Burnout Chart internally as a way of monitoring collective adherence to this vital agile principle. Perhaps teams in that situation could use the Burnout Chart to raise unsustainable pace as an organizational impediment.

Next time you notice that your team is showing signs of exhaustion, perhaps a Burnout Chart would be a useful way of determining - and radiating - the cause.

All for now....

...-.-